
Now I am become QPR, destroyer of optimists - AnalysisTuesday, 17th Oct 2023 14:45 by Andrew Scherer
In the second of our analytics deep dives for this international break, Andrew Scherer digs into the numbers for a data-based look at how QPR have performed so far this season, and it's every bit as bleak as you would imagine.
I am an eternal optimist. Lord knows why, I've been going to QPR for 33 years.
As if the Rs weren't enough, my baseball team is the Chicago Cubs. The Cubs have won a solitary World Series since 1908. They didn't even reach a World Series for a 71 year period from 1945 (the Curse of the Billy Goat era), before finally, finally breaking the curse in 2016.
Having slowly dismantled that winning 2016 side, the Cubs have spent the last few years rebuilding and, after a slow start to the 2023 season, really found their feet through July and August. They came into this September as one of baseball's form teams, with a 94% chance of reaching the October play-offs. No prizes for guessing what happened next.
Yet seemingly no collapse, no relentless losing streak, whether at Loftus Road or Wrigley Field, is enough to dissuade me of my natural positivity.
I say all this to give some context to the following statement: even I think QPR are in real trouble.
The results are, of course, concerning. But it is the data underlying the performances that's causing me real disquiet. I am going to try and dig into that data here to build a picture of where QPR are as a team and you can perhaps form your own view.
And more broadly, using data to explain an inherently fluid and chaotic sport like football is always going to have its limitations. But what it can do is help strip out your natural biases/optimism/pessimism, pick up things the naked eye has missed, and confirm/disprove any pre-existing hypotheses.
If your pre-existing hypothesis is that QPR are really not very good this year, have I got some confirmatory data for you.
All data is taken from fbref.com, apart from the set-piece xG numbers, which are from Opta Analyst. For anyone unfamiliar, some key terms explained:
Expected goals/expected goals against/expected goal difference (xG/xGA/xGD): A measure of the quality of a chance. Excellent explainer in Clive's interview with head of recruitment Andy Belk.
Expected assists (xA): A measure of the quality of a provided chance (ie the likelihood a pass becomes an assist for a goal).
Expected points (xP): A measure of the likelihood of a result based on a match's xG (I have used a Monte Carlo simulation to calculate this). Longer explainer here.
Field tilt: Number of touches a team takes in the opposition third as a proportion of the total touches both teams have taken in the opposition third (e.g. if QPR have 30 touches in the opposition third and their opponents have 70 touches in QPR's defensive third, QPR's field tilt will be 30%).
Progressive receives: A measure of the number of completed passes a player or team is on the end of that moves the ball at least ten yards further forward or into the opposition penalty area.
Not much we can do to sugar coat this so let's dive straight in: we are doing badly across a range of fundamental measures.
Our xP sits at 9.3: marginally better than our actual points total but still the third worst in the league. Going forward, we average 0.77xG per game (also 22nd) and at the back our xGA is 1.65/game (21st). That combination of poor attack and defence means we have the second worst expected goal difference in the league of -9.6, with only Rotherham (-13.7) worse.
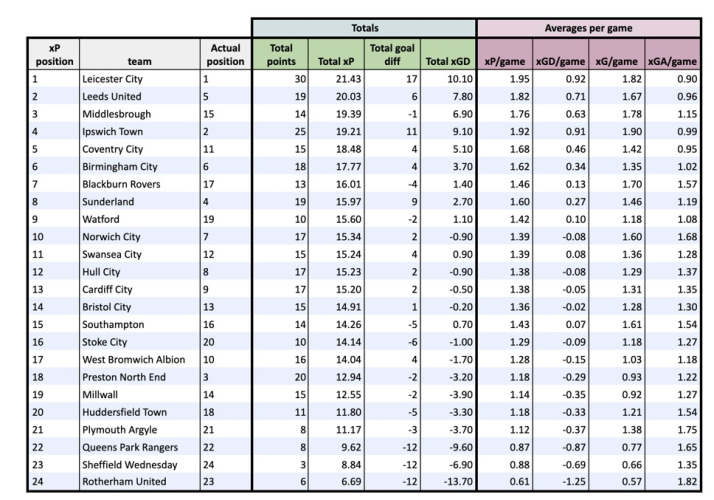 Championship table ranked by expected points
In essence, it does seem we are as bad as the results suggest.
I will dig into our attack and defence shortly, but for another sense of underlying performance, let's plot xGD alongside field tilt, which gives a sense of how much a team is dominating the ball in the opposition third versus how much they are allowing the opposition to do so.
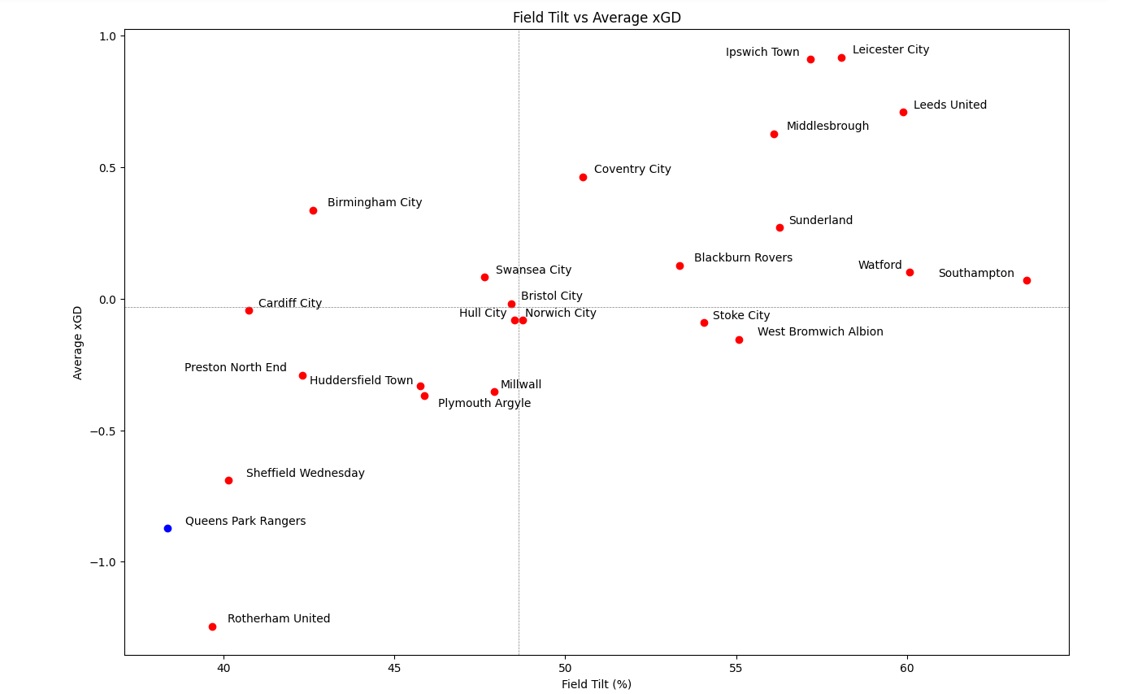 Broadly, the top right quadrant are teams who dominate the ball and create more chances than they concede. Top left is teams who create more chances than they concede without dominating the ball. Bottom right is teams who dominate possession but struggle to create a positive balance of chances, bottom left is teams who give up more chances than they make AND have limited meaningful possession.
As you can see, there are three teams clearly lagging behind the rest of the league; unfortunately for the 'find three worse teams than us' mission, we are one of them. Indeed, our field tilt (38%) is the worst in the Championship: we give up a lot of dangerous possession while recording little ourselves.
Fundamentally, we currently look like a bottom three club based on this data. I can proffer one small mitigation, however.
Until you reach the halfway stage of the season and everyone has played each other, results can be disproportionately impacted by the fixture list. If we look at the xP table, we have played 11 of the top 13. You can also see this in the xGD v field tilt graph: we have played every team in the top right quadrant, bar Leicester.
There is, of course, some risk of self-fulfilling prophecy with a small sample size of games (i.e. these teams might not have accumulated as much xP if they hadn't played us). But, in theory, we have more 'easier' fixtures coming up. Whether we are able to take advantage of them remains to be seen.
Before we go on to look at where we are struggling in more detail, a couple of interesting points to note with other teams. You can see that Middlesbrough have the biggest discrepancy between their xP position and actual position. They have now started to motor, though, and I would expect them to continue to power up the league. Blackburn and Watford may also be worth keeping an eye on as the data indicates they have also been performing better than their results suggest (certain 4-0 wins notwithstanding). Conversely, Preston have now lost three on the spin and I wouldn't be surprised to see them continue to fall away.
Finally, if a managerial change is coming at Loftus Road and you feel we don't have the squad to play possession football, you could do worse than have a look at whoever has been in charge at Birmingham...
I am sure the fact we are towards the bottom of the league for key attacking metrics will have surprised no-one. The interesting question is why: what are the failings that mean we don't score many?
At a high level, teams often struggle because they are missing chances, they create poor quality chances, or they do not create sufficient volume of chances. Let's look at each of these in turn.
Missing chances: Although we have had a few glaring misses (Kakay against Ipswich immediately springs to mind), we are not especially profligate in front of goal. As we have already seen, we have scored eight goals from an xG of 8.5, which is a slightly below average return but nothing concerning, particularly across an eleven game sample.
Quality of chances: So, is it the quality of chance? Again, not particularly: if you look at our average non-penalty xG per shot (ie xG taking penalties out to avoid skewing the data), it is 0.09: our average shot will have a ~9% chance of scoring. This is 19th best in the league and below the average of 0.1, but not dreadful. Average distance of shots taken can also be a decent proxy of quality of chance (ie the closer to goal you are, the more likely you are to score). On average we shoot from 17.39m, versus a league average of 17.57m: again, the data suggests the chances we create are OK-ish.
Volume of chances: It is, instead, the volume of chances that is our biggest concern. There are plenty of ways this shows up in the data.
If we take a relatively crude measure to start with, we average 9.55 shots per game (8.4/game before our 21 pot shots against Blackburn). This is 21st in the league and compares pretty unfavourably to the league average of 12.8/game.
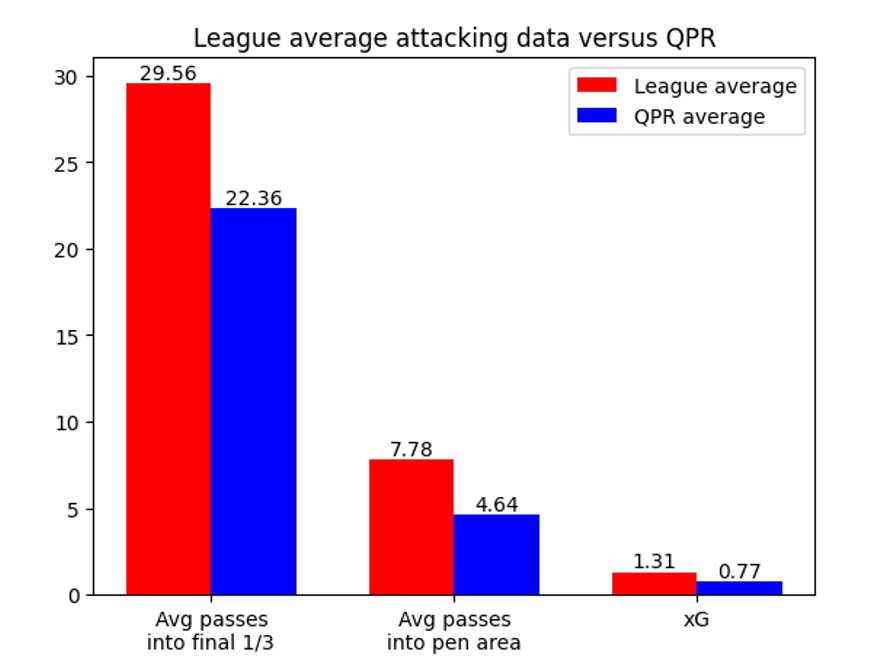
To create chances, you clearly need to get the ball forward. One measure of this is successful passes into the final third of the pitch. Anyone who has watched us will know this is a struggle - certainly my overriding impression is how often we rely on launching the ball forward in order to get into the opposition half (more on this later). We average 22.36 successful passes into the final third per game, which is 21st in the league and well down on the average of 29.56.
And we are even worse at progressing the ball into the opposition area, with an average of 4.64 passes into the area per game against a league average of 7.78 (only Rotherham are worse). The fact we do worse and worse the higher up the pitch we go is highlighted by the fact that, on average, we play almost five passes into the final third for every pass into the penalty area (again, 23rd in the league and only Rotherham are worse). We simply do not get the ball into the final third enough and, once there, we find it difficult to get the ball into the area.
Taken individually, these measures aren't necessarily a concern per se; it is the fact we are close to the bottom for all of them that tells a story (by way of comparison Leicester have a similarly low proportion of passes into final third to passes into the penalty area as us - but they play the ball into the final third almost twice as much as we do).
 When we do get the ball forward we create OK chances, we are not overly wasteful of those chances, but we just do not get the ball into dangerous areas anywhere near enough.
Having established that the lack of chances created is driving our low xG, it seems sensible to look in more detail at what we do with the ball when we do have possession (which is 39.2% of the time, on average - the third lowest in the league).
Long balls for the loss: It will surprise no-one to learn that passing is not our forte. We attempt the fourth fewest passes per game on average, with the fourth worst pass completion rate in the league (68.8% versus league average of 76.2%).
24.25% of those passes go long: the third most in the league, behind Huddersfield and Rotherham. Our average long ball completion is 44.18% (20th, against a league average of just under 50% avg): this would seem to add credence to the sense we are either inaccurate with our passing, or maybe over-reliant on hit-and-hope balls over the top, something that is not conducive to creating attacking threat.
If we plot the percentage of long balls played versus xG, you can see a clear inverse correlation: typically, the higher the proportion of long balls a team plays, the lower their average xG.
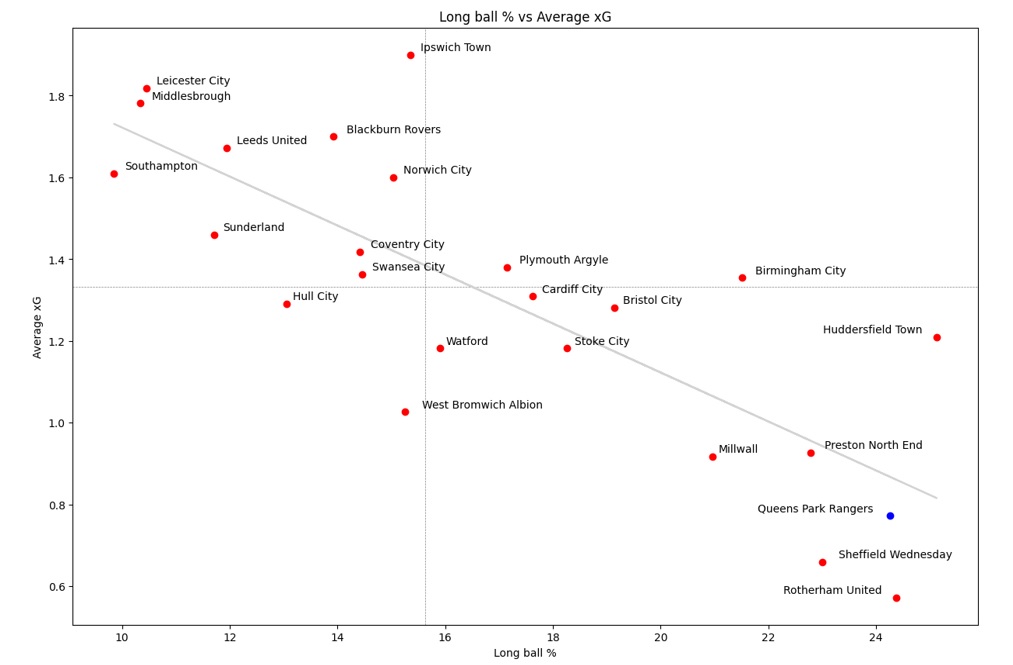 You can, of course, get into a debate about correlation and causation here: do teams that rely more on long balls do so because they have worse players and therefore their low xG is a factor of inherent quality rather than the long ball tactic per se? There's probably some truth to that, and you can of course create enough chances with direct play to do well (see Luton last year). But, looking at the top right quadrant there are currently only two teams who play more long balls than the median AND create more xG than the median (Plymouth and, ahem, Birmingham).
Making me cross: In addition to a direct style of play, there has long been an assumption that an Ainsworth side firing on all cylinders would carry threat from out wide. It certainly feels like this has been a feature of some of our better games under Wild Thing (eg Watford at home last season, Cardiff away).
Looking at our crossing stats, we are mid-table for both number of crosses per game and percentage of successful crosses (17.91/game versus league average of 17.4 and 10.15% versus average of 11.01%).
I would therefore argue that, stylistically, we are trying to be a crossing team, we just don't get the ball into dangerous areas enough to make this an effective tactic. Interestingly, if you compare our first six games with our last five, our average crosses per game has gone from 13.8 to 22.8, which suggests that (rightly or wrongly) this is becoming an even more important part of our game plan.
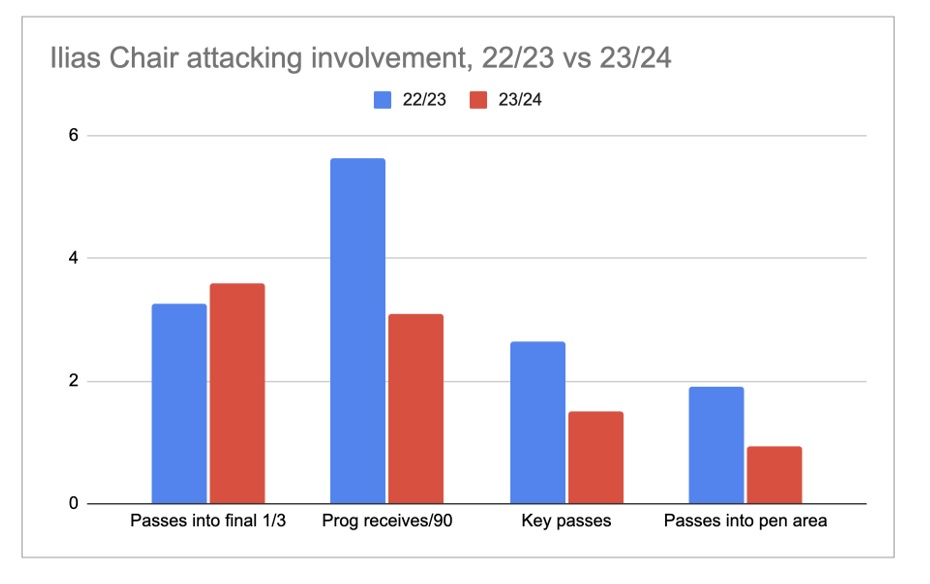
What have we done to Ilias Chair: Which brings us to Ilias Chair. I could do a whole piece on individual player stats (he threatens) but I do want to draw attention to Chair because he was so crucial to our attacking threat last year and now...less so.
In 22/23, Chair averaged 0.31 expected assists (xA) per 90 mins. This was, unsurprisingly, higher under Beale (0.36 xA per 90) than Ainsworth (0.25 xA per 90) but across the course of the whole season Chair still posted the best xA rate of any player in the Championship who played at least 400 minutes.
This season, Chair is a shadow of that player (from an assists perspective, at least): he is averaging 0.1 xA per 90, which is only third best at QPR, behind Paal and Smyth, let alone the league as a whole.
Is this drop-off down to changes in style? We're a touch more direct (22.98% long balls under Ainsworth last year versus 24.25% this year) but nothing significant there. We registered 21.54 crosses per game in Ainsworth's 13 matches last season, which is above our current average but very similar to our last five games (and Chair's average xA rate has remained pretty steady this season).
So, if it's not an obvious style change, is it the job Chair is being asked to do? Well perhaps.I do not have access to data on player positioning so this is still a loose hypothesis, but it may well be that Chair is now sitting quite a bit deeper (either by design or as a factor of our inability to get good possession higher up the pitch).
There are a few measures that provide some evidence of this. Firstly, looking at his individual passes into the final third, last year Chair averaged 3.25 per 90 minutes. This season that is up around 10% to 3.58. In the same vein, last year he averaged 5.63 progressive receives per 90, this year that is down 45%(!) to 3.1 per 90: i.e. Chair is doing more passing to others in attacking positions than he is being the one passed to.
This is also borne out by his stats for key passes (ie passes that lead to a shot) and passes into the penalty area. In 22/23 Chair averaged 2.64 key passes and 1.9 passes into the penalty area per 90 minutes, in 23/24 that is down to 1.51 key passes and 0.94 passes into the penalty area per 90: he simply isn't influencing play further forward as much as he was.
 Whether part of a plan or an unexpected consequence of our set up, I think it is reasonable to question why we have nullified the Championship's most dangerous chance creator like this.
Speaking ill of the dead (balls): One final attacking aspect to cover: set pieces. It is no secret that maximising threat from set pieces can go a long way towards covering deficiencies in open play. That is why well-run clubs employ specific experts who attempt to eke every last edge out of them (e.g. a certain well-run bus stop down the road is the most threatening dead ball side in the Premier League, with 0.62 xG per game from set pieces).
We do not cover our deficiencies in open play with set pieces.
Our average xG from set pieces is 0.175 xG/game, which is 20th in the league. That, to me, is leaving goals on the table.
Unfortunately our travails do not stop at a blunt attack. While our xGA is not quite as bad as our xG, it's still relegation form territory. So, let's have a look at where the leakiness is coming from.
We can use the same three high-level drivers of attacking issues (quality of finishing, quality of chances, volume of chances) to analyse defensive vulnerability. Unlike our attack, where the issues are centred around the (low) volume of chances we are able to generate, our defensive weakness can, to varying degrees, be attributed to all three aspects.
We have conceded 20 goals from an expected 18.1 goals against. So, a slight underperformance defensively (we are 15th in the league for goals against versus xGA) but nothing wildly different that would suggest we've come up against red hot strikers. Asmir Begovic, however, isn't covering himself in glory. We can measure goalkeeper shot stopping by post-shot xG (PSxG) and Begovic's cumulative goals conceded versus PSxG is -2.1, i.e. he has conceded around two more goals so far than we might expect - the fifth worst rate in the league.
In terms of quality and quantity of chances against us, we average 0.106 npxg per shot against, which puts us 19th in the league. The average distance of shots against us is 16.83m, which is 20th in the league. Meanwhile, we allow 15.27 shots/game against us, which is also 20th in the league.
Essentially, we give up too many chances and those chances are of a decent quality and our goalkeeper is underperforming with his shot-stopping.
Open sesame: Does the data give us any indication of any specific weaknesses that drive this?
Well, our old friends 'passes into the final third' and 'passes into the penalty area' do give us some idea: we allow the most passes into our defensive third of any team in the league (40.18/game, compared to the league average of 29.54) and the second most passes into our penalty area (11.18/game, league average = 7.78).
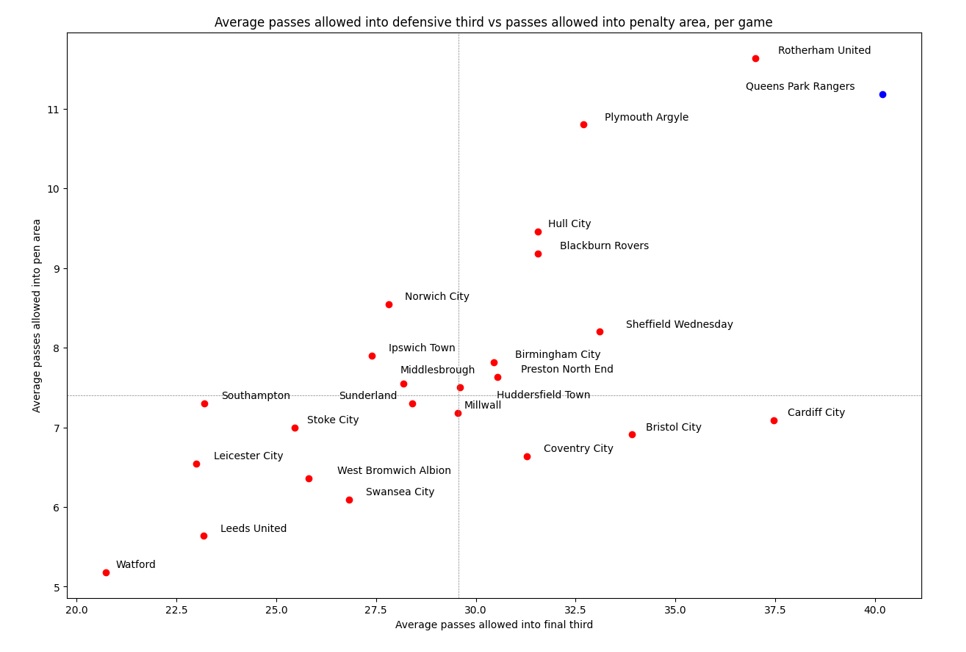 As you can see from the graph, we are painfully open compared to almost every other team. It is, I think, safe to say this openness is at the heart of a lot of our defensive woes. Though looking at this in more detail, an interesting pattern emerges that I want to flag.
Let's take passes into the final third, passes into the penalty area, and xGA as broad measures of an opponent progressing closer to our goal.
We allow one pass into our penalty area for every 3.59 passes into the final third, putting us 16th in the league for this measure. If we look at how our xGA stacks up against passes into the final third, we are ninth in the league: the opposition produce one expected goal for every 24.42 passes into our defensive third. And it takes other teams 6.8 passes into the penalty area to create one expected goal against us: this is the sixth best ratio in the Championship.
It seems, therefore, that the closer to our own goal we get, the better we defend. (There isn't any clear correlation between these measures and league position, so it doesn't seem to be a quirk of the fact we concede so many chances).
This, to me, passes the sniff test from watching us play: when we get bodies back there is generally not a shortage of blocks, tackles etc going in. But before that point we are waaaaaay too open: teams cut through our press (such as it is) with ease and almost every turnover of the ball when we are attacking feels like it puts us in immediate danger.
The 'OK at defending own area' hypothesis is borne out in the crossing data as well: we concede too many crosses (19.73/game, 19th in the league) but do alright at repelling them (10.6% of crosses we face successfully find an attacker, which is mid-table and better than the league average of 11.16%).
I know it wasn't pretty, but is there a case, at least temporarily, to return to the very low block we saw at the end of last season?
Speaking ill of the dead (balls), part deux: Unfortunately, vaguely competent defending of our own box does not extend to dead ball situations. I've already highlighted the value of set pieces from an attacking perspective, naturally the flip side of this is the importance of defending them properly.
We do not defend them properly.
Our xGA from set pieces is 0.39/game, the third worst in the league. In a season that could well be decided by fine margins, this is asking for trouble. (As a side note, having drawn attention to some of Eustace's positive impact at Birmingham, it would be remiss not to mention the fact that Birmingham currently have the worst xGA from set pieces in the league, conceding 0.44xGA from them per game).
Things do not, it is fair to say, look great. But as we highlighted at the start, it is still relatively early days in the season and, to a degree, in Ainsworth's reign (if you take the starting point proper to be the summer).
It is therefore worth looking at comparable teams from previous seasons for any clues as to whether an improvement is on the way - or if we are doomed, doomed, I tell ye.
To do this we can look at the results of teams who play with a similar style and also how teams who have made similar starts to us have gone on to fare. We'll use data from the past four seasons to do this.
Stylistically: Focusing on our passing and possession statistics, we can utilise a bit of machine learning to help identify teams who have played in a similar way: specifically, using a cosine similarity algorithm.
I have split out the data to find comparable teams from both an attacking and a defensive sense. The higher the score, the closer they are in style to QPR 23/24 (e.g. QPR 23/24 would have a score of 1.00).
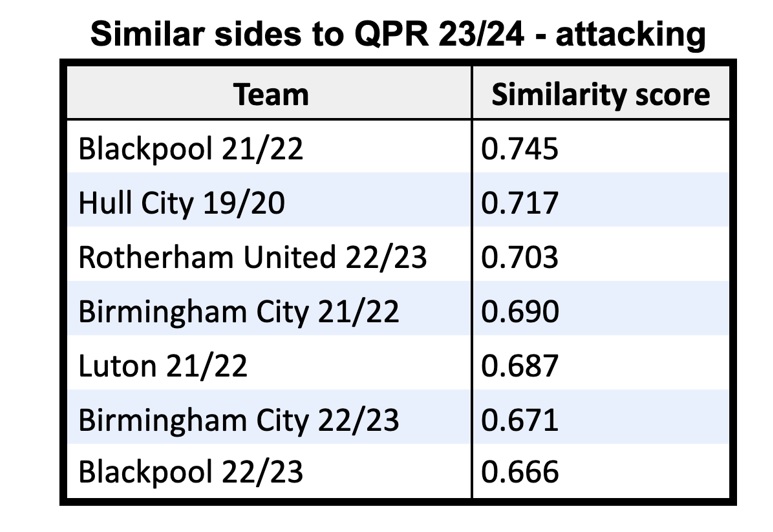
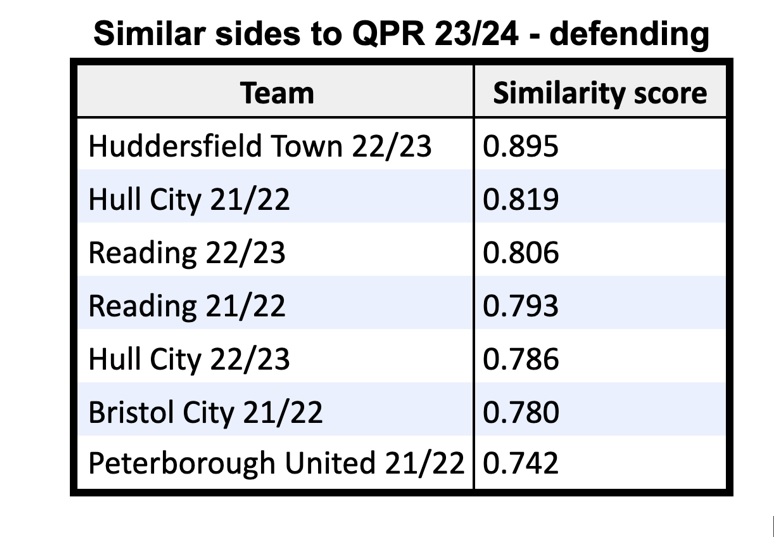 You only need a quick glance at the lists to see it's not a who's who of quality Championship sides. But for completeness, these teams averaged 1.15 xP/game, which would equate to 81st out of 96 teams. Luton Town 21/22 is the only one to finish in the top half (you will recall they snuck into the play-offs), showing you can be successful without being a passing, possession-based side - but it is rare.
As discussed above in relation to teams' tendency to play long balls, there may be a bit of chicken and egg here: teams posting these kinds of numbers for stylistic measures may be doing so because of the quality of players at their disposal and therefore poor performance may be a factor of that. Nevertheless, it does paint a clear picture: very direct teams, teams that allow the opposition a lot of possession in their own halves, will typically struggle to do well.
Performance-wise: What about teams who have posted similar key performance metrics? We'll look at xGD and xP, again for the previous four seasons. Have any teams stayed up with similar numbers to us? Or have there been any notable turnarounds from comparatively weak starts?
Starting with expected goal difference: the bad news is no team in the past four years has recorded an xGD as bad as our -0.87/game over the course of a whole season (it is worth referencing that we registered -0.63 xGD/game under Ainsworth last season).
What if we only look at the first eleven games of a season? Some good news, of sorts: we have made a better start in terms of xGD than such luminaries as Reading 21/22, Barnsley 21/22, Barnsley 19/20, and Peterborough United 21/22 - only half of whom went down.
And expected points? Similar to xGD, there is no team with a worse xP record per game across a full season - though this year Rotherham are worse off and Sheffield Wednesday are only marginally better than us. (Again, we fared better under Ainsworth last season - 0.99 xP/game versus 0.88 xP/game this term).
Restricting things to the first eleven games, there are three teams who have posted worse xP starts than us: Barnsley 21/22, Peterborough United 21/22 (both of whom went down) and Derby County 20/21 (who survived on the last day).
If we look to the next seven teams above us in our multi-season table, things do look a little more positive with six of those surviving: Barnsley 19/20 (0.89 xP/game in first eleven matches), Reading 21/22 (0.89xP/game), Hull 22/23 (0.94xP/game), Coventry 21/22 (0.96 xP/game), Hull 21/22 (0.99 xP/game) and perhaps most notably Coventry 22/23 (1.05 xP/game). There are specific circumstances with a number of those teams, particularly the takeovers at Hull and Coventry, but some cause for optimism.
The one team of those seven to go down? Wycombe Wanderers 20/21 (0.99 xP/game). (Jesus Christ - ed)
That is, I am sure you'll agree, more than enough downbeat statistical navel gazing for one article.
As I was at pains to point out at the start, there will absolutely be any number of nuances and contradictions that I have skipped over or that aren't captured in the data available - so do not take anything I have said as gospel.
Nevertheless, what I have tried to do is use the numbers to paint a fair picture of where we are at as a team in order to supplement what you can see and perceive yourself. While there is no getting away from the fact it is a really poor start, it is not necessarily terminal to our chances of staying up.
Survival does rest, however, on significant improvements. If we find a way to utilise Ilias Chair better, if we stem the steady flow of dangerous passes through our midfield, if we - shock horror - make even a little progress on set pieces, I think we have a puncher's chance.
But then I would think that, wouldn't I?
Pictures - Ian Randall Photography
The Twitter @scheze, @loftforwords
Ian Randall Photography
Please report offensive, libellous or inappropriate posts by using the links provided.
baz_qpr added 15:20 - Oct 17Super interesting would've to see comparison between Beales, first 11 games Critchley's 11, Ainsworths last season and this season
 scheza added 15:44 - Oct 17Good question and there is a bit of that in my thread from the summer - it's largely as you might expect
 A DATA-BASED LOOK AT #QPR'S 22/23, WITH REASONS TO BE PESSIMISTIC AND OPTIMISTIC ABOUT NEXT SEASON I had a dig into our 22/23 data to try and make sense of the season, so thought I'd share some thoughts/conclusions in a (long) thread, backed by SCIENCE* ... /1